ChatGPT Mapping
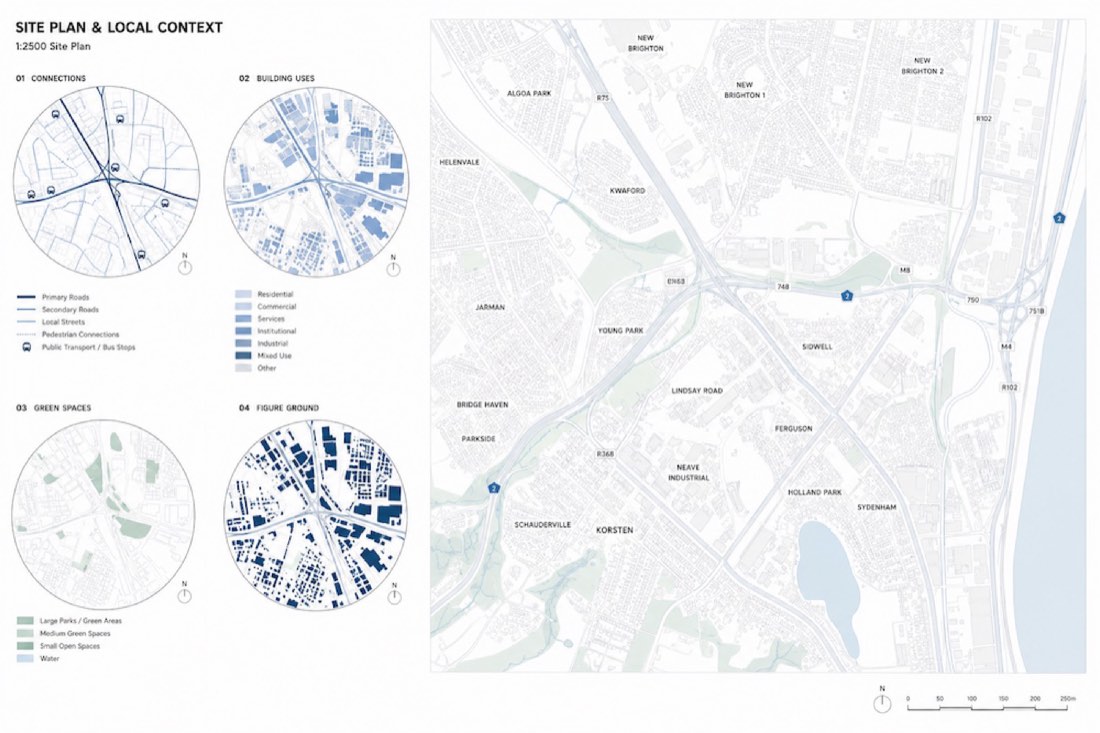
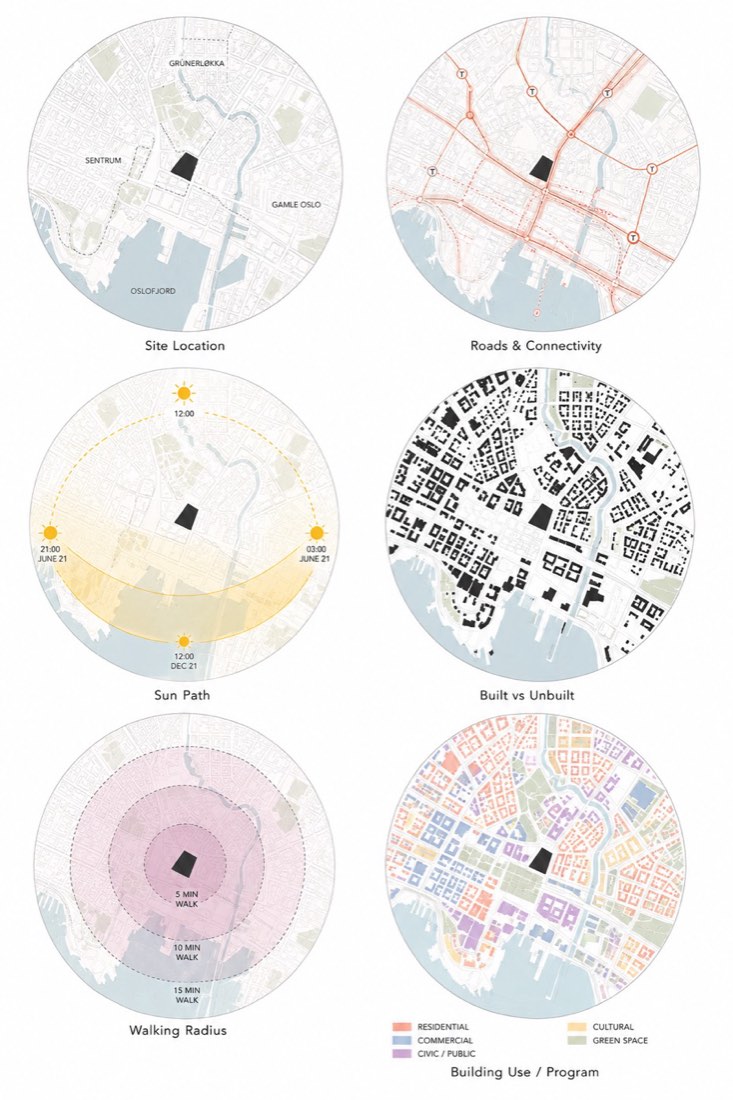
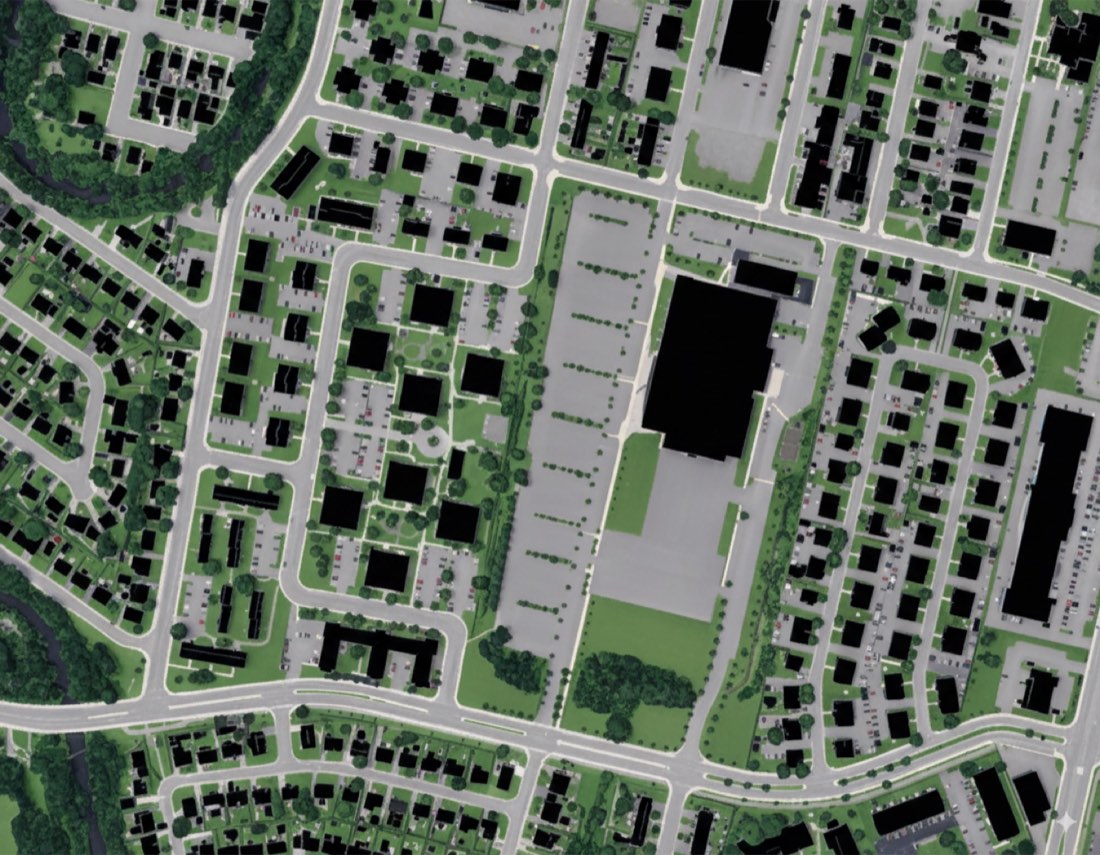
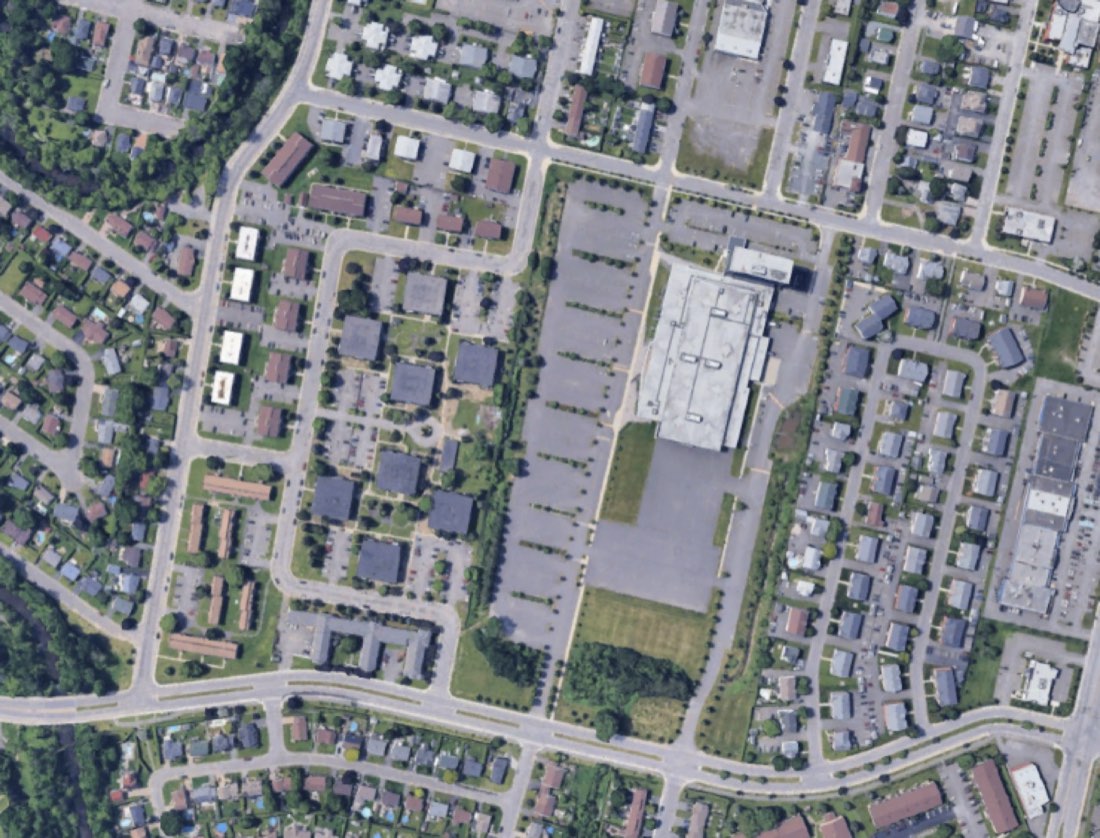
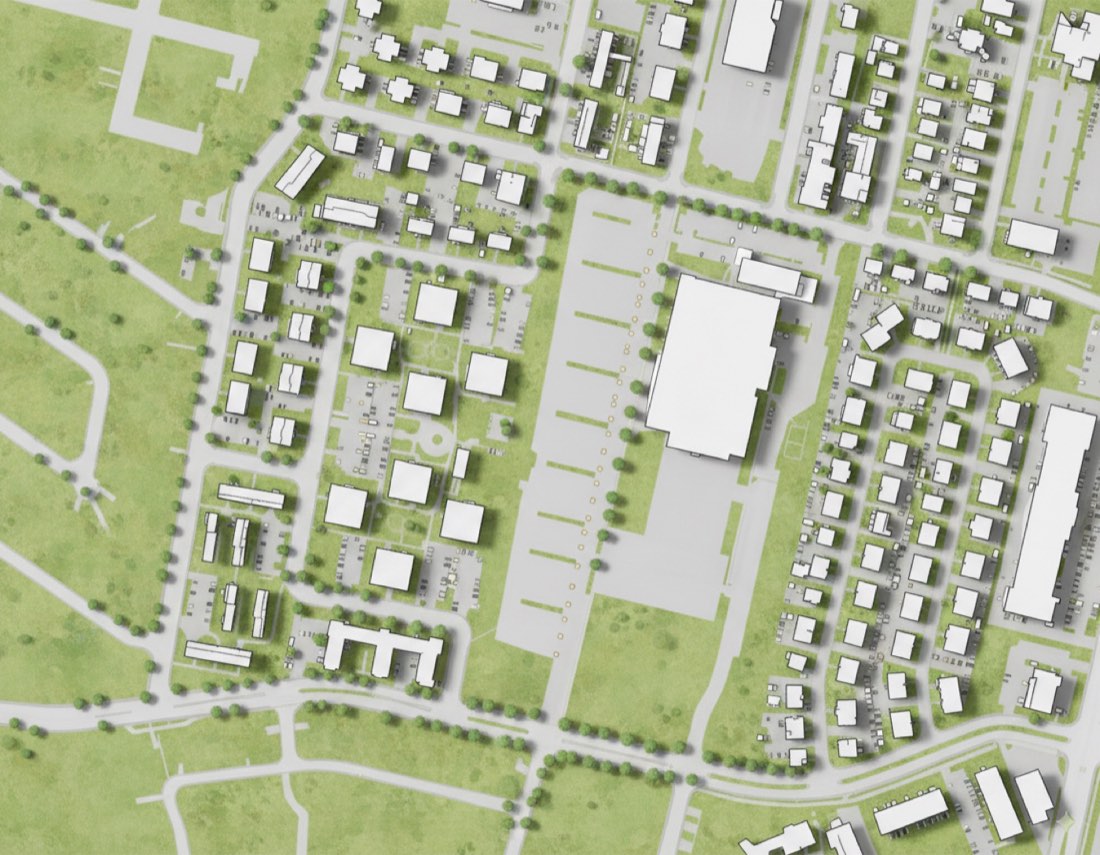
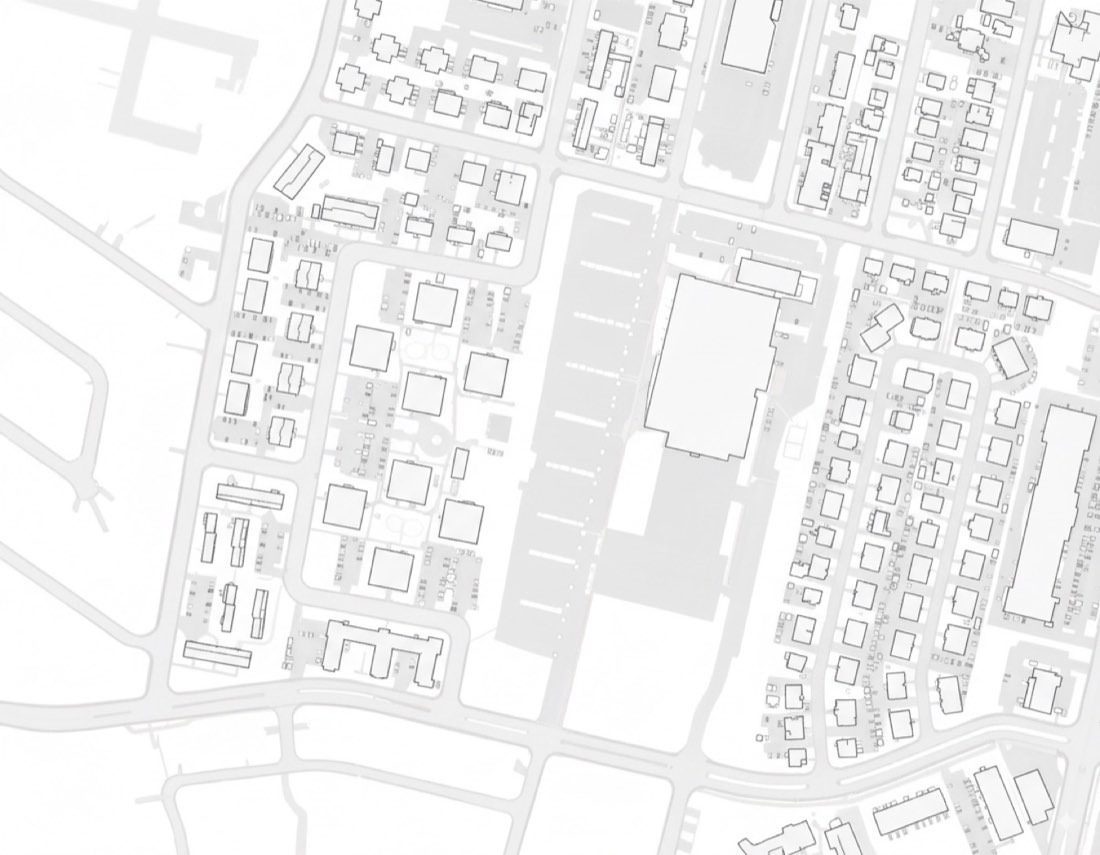
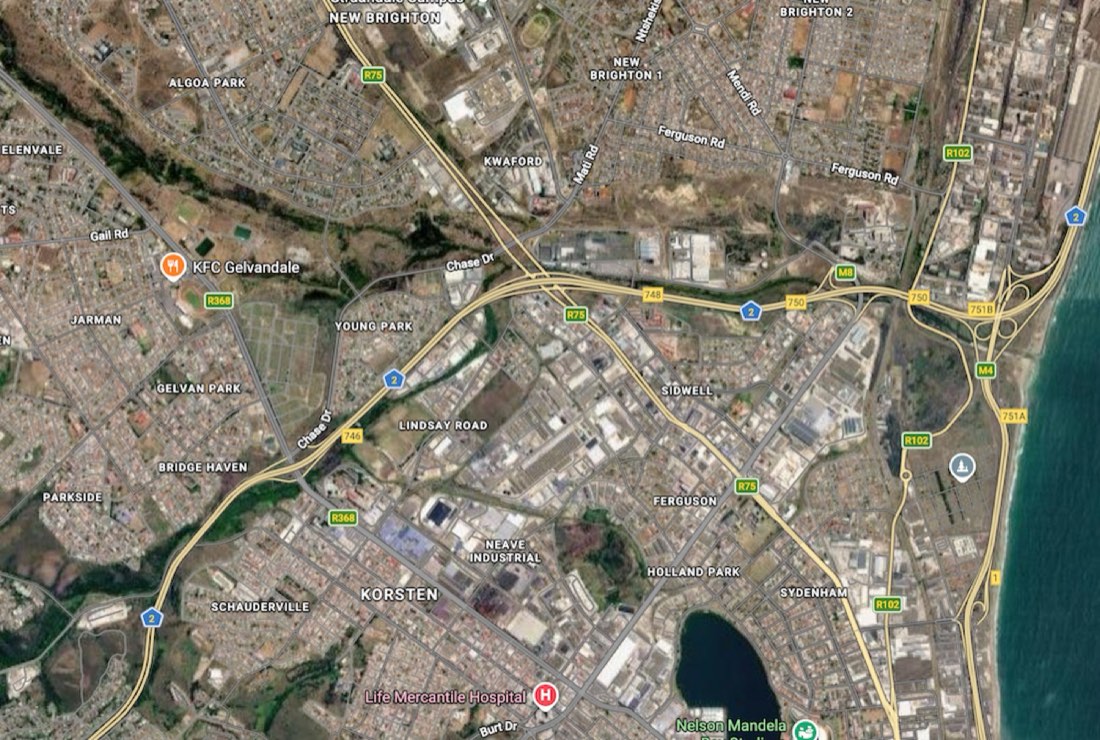
Transform my uploaded site plan / urban context map into a professional architectural SITE PLAN & LOCAL CONTEXT analysis board in the same graphic language as the reference. IMPORTANT — PRESERVE THE REAL SITE: Treat my uploaded plan as the fixed geographic base. Preserve exactly: - site boundary - street network - building footprints - block structure - existing open spaces - major infrastructure - orientation - surrounding urban fabric - relative scale and proportions Do not redesign the site. Do not invent roads, buildings, blocks, or landscape features. Do not distort the original geography. BOARD LAYOUT: Create a clean landscape-format architectural analysis board on a pure white background. Use an asymmetrical editorial composition: LEFT SIDE — approximately 35–40% of the board Create four small analytical diagrams arranged in a clean 2 × 2 grid. RIGHT SIDE — approximately 60–65% of the board Create one large detailed contextual site plan. Maintain generous white negative space between all diagrams. MAIN TITLE: Place a small bold title in the upper-left: SITE PLAN & LOCAL CONTEXT: BELOW IT, ADD A SMALL SUBTITLE: 1:2500 SITE PLAN: Use compact architectural sans-serif typography. 01 — CONNECTIONS: Create a circular analytical map derived from the actual site plan. Show: - primary roads - secondary roads - pedestrian connections - public transport / bus stops where applicable - important movement routes - relationship between the site and surrounding street network Use different line weights rather than excessive colors. Primary routes: dark desaturated navy-blue. SECONDARY ROUTES: MEDIUM MUTED BLUE.: LOCAL CONTEXT: VERY PALE BLUE-GREY.: Keep the diagram minimal and diagrammatic. 02 — BUILDING USES: Create a second circular analytical map using the same geographic extent. Classify surrounding buildings by program where information is available, such as: - residential - commercial - services - institutional - mixed use - other relevant categories Represent each category using a restrained monochromatic blue palette. DO NOT USE RAINBOW COLORS.: Keep streets and background context extremely pale so the building-use information is dominant. 03 — GREEN SPACES: Categorize green spaces according to aerial photo. Use progressively darker shades of the same blue family. large park = pale green. small open space = dark navy-green. Maintain exact footprints from the source map. 04 — FIGURE GROUND: Create a simplified architectural figure-ground diagram. Remove unnecessary contextual information. SHOW ONLY: BUILDINGS: solid dark desaturated navy-blue. GROUND / STREETS / OPEN SPACE: pure white. Preserve the exact real building footprints and urban morphology. This diagram should be extremely clean and abstract. MAIN CONTEXTUAL SITE PLAN: On the right side, create a much larger detailed site plan showing the complete local urban context. Use precise architectural / GIS-style linework. Existing surrounding buildings: very pale grey-blue outlines with subtle transparent fills. ROADS: PALE COOL GREY.: MINOR STREETS: EXTREMELY LIGHT GREY.: Landscape / open space: very pale desaturated blue-green or grey-green. WATER, IF PRESENT: VERY PALE MUTED BLUE.: The site should be clearly visible without becoming a large saturated graphic shape. Use subtle transparent blue overlays to identify important local relationships. Add only a few carefully selected analytical lines where useful. Do not overcrowd the main map with arrows, icons, labels, or graphic effects. COLOR PALETTE: Use a tightly controlled monochromatic architectural palette. SUGGESTED COLORS: DARK NAVY #174B63: DEEP BLUE #2F6B86: MEDIUM BLUE #6F9EB6: SOFT BLUE #AFC9D6: PALE BLUE #DCE8ED: VERY PALE BLUE-GREY #EEF3F4: CONTEXT GREY #D9DDDD: WHITE #FFFFFF: OPTIONAL MUTED LANDSCAPE TONE: #DDE8E2: Use approximately 80–90% white / pale grey context and only 10–20% stronger blue information. Do not introduce additional saturated colors. GRAPHIC LANGUAGE: The final result should resemble a professionally prepared architecture / urban design analysis board created using: CAD + GIS + ILLUSTRATOR + INDESIGN.: CHARACTERISTICS: - precise vector-like linework - thin grey contextual lines - flat color fills - restrained transparency - consistent blue palette - clean circular analytical diagrams - strong information hierarchy - generous white space - small architectural typography - minimal legends - subtle north arrows - professional competition-board aesthetic VERY IMPORTANT — AVOID AI LOOK: Do NOT use: - gradients - glowing edges - watercolor textures - painterly effects - 3D buildings - perspective - realistic trees - decorative shadows - random blue patches - excessive transparency effects - artificial texture - blurred boundaries - thick outlines - oversized icons - unnecessary arrows - invented urban information All colors should appear as clean, controlled, mostly FLAT vector fills. The image should look manually constructed in Illustrator / InDesign from accurate CAD or GIS data, NOT generated by AI. FINAL OUTPUT: Strict orthographic top-down representation. LANDSCAPE ORIENTATION.: One large contextual site plan + four smaller analytical diagrams. PURE WHITE BACKGROUND.: Precise, minimal, highly legible architectural graphic design. The uploaded site geometry must remain accurate throughout all five diagrams.
把我上传的总平面图/城市环境地图,转换为一张专业的建筑“总平面与周边环境”分析展板,采用与参考图相同的图示语言。 重要——保留真实场地: 把我上传的平面作为固定的地理底图。 完全保留: - 场地红线 - 街道网络 - 建筑轮廓 - 街区结构 - 现有开放空间 - 主要基础设施 - 朝向 - 周边城市肌理 - 相对尺度和比例 不要重新设计场地。 不要虚构道路、建筑、街区或景观要素。 不要扭曲原有地理。 展板版式: 在纯白背景上制作一张干净的横版建筑分析展板。 使用不对称的杂志式构图: 左侧——约占展板的 35–40% 用干净的 2 × 2 网格排布四张小分析图。 右侧——约占展板的 60–65% 绘制一张大的详细环境总平面图。 所有分析图之间保持充足的白色留白。 主标题: 在左上角放一个小号粗体标题: SITE PLAN & LOCAL CONTEXT(总平面与周边环境) 下方加一个小副标题: 1:2500 SITE PLAN(1:2500 总平面) 使用紧凑的建筑无衬线字体。 01 —— 交通联系: 根据实际总平面生成一张圆形分析地图。 表现: - 主要道路 - 次要道路 - 步行联系 - 公共交通/公交站(如有) - 重要通行路线 - 场地与周边街道网络的关系 用不同线宽而不是过多颜色来区分。 主要路线: 深色低饱和海军蓝。 次要路线: 中等柔和蓝。 周边环境: 很浅的蓝灰色。 保持分析图极简、示意化。 02 —— 建筑功能: 使用相同的地理范围,生成第二张圆形分析地图。 在有信息的情况下,按功能对周边建筑分类,例如: - 住宅 - 商业 - 服务 - 机构 - 混合功能 - 其他相关类别 每个类别用克制的单色蓝系配色表示。 不要使用彩虹色。 街道和背景环境保持极浅,让建筑功能信息占主导。 03 —— 绿地: 根据航拍照片对绿地分类。 使用同一蓝色系中逐级加深的色调。 大型公园 = 浅绿色。 小型开放空间 = 深海军绿。 保持与源地图完全一致的轮廓。 04 —— 图底关系: 制作一张简化的建筑图底关系图。 去掉不必要的环境信息。 只显示: 建筑: 实心深色低饱和海军蓝。 地面/街道/开放空间: 纯白。 完全保留真实的建筑轮廓和城市形态。 这张图应极其干净、抽象。 主环境总平面: 在右侧绘制一张大得多的详细总平面,展示完整的周边城市环境。 使用精确的建筑/GIS 式线条。 周边现状建筑: 很浅的灰蓝色轮廓,配淡淡的透明填充。 道路: 浅冷灰。 次要街道: 极浅的灰色。 景观/开放空间: 很浅的低饱和蓝绿或灰绿。 如有水体: 很浅的柔和蓝。 场地应清晰可见,但不要变成一大块高饱和的图形。 用细微的透明蓝色叠加标出重要的周边关系。 只在有用处加入少量精心挑选的分析线。 不要在主图上堆满箭头、图标、标签或图形效果。 配色: 使用严格控制的单色建筑配色。 建议颜色: 深海军蓝 #174B63 深蓝 #2F6B86 中蓝 #6F9EB6 柔和蓝 #AFC9D6 浅蓝 #DCE8ED 很浅的蓝灰 #EEF3F4 环境灰 #D9DDDD 白色 #FFFFFF 可选的柔和景观色: #DDE8E2 约 80–90% 为白色/浅灰环境,只有 10–20% 为较深的蓝色信息。 不要引入其他高饱和颜色。 图示语言: 最终结果应像用以下工具专业制作的建筑/城市设计分析展板: CAD + GIS + Illustrator + InDesign。 特点: - 精确的矢量式线条 - 细的灰色环境线 - 平涂填色 - 克制的透明度 - 统一的蓝色配色 - 干净的圆形分析图 - 强烈的信息层级 - 充足的白色留白 - 小号建筑字体 - 极简的图例 - 低调的指北针 - 专业的竞赛展板美感 非常重要——避免 AI 感: 不要使用: - 渐变 - 发光边缘 - 水彩纹理 - 绘画效果 - 3D 建筑 - 透视 - 写实树木 - 装饰性阴影 - 随意的蓝色色块 - 过多的透明效果 - 人工纹理 - 模糊的边界 - 粗轮廓 - 过大的图标 - 不必要的箭头 - 虚构的城市信息 所有颜色都应是干净、有控制、以平涂为主的矢量填充。 图像应像是根据准确的 CAD 或 GIS 数据,在 Illustrator/InDesign 中手工制作的,而不是 AI 生成的。 最终输出: 严格的正投影顶视表现。 横版。 一张大的环境总平面 + 四张较小的分析图。 纯白背景。 精确、极简、高度易读的建筑平面设计。 上传场地的几何在全部五张图中都必须保持准确。